Solving eq. 1 for X, we have X = C/5.
Substituting this into both of the other equations, we get:
The last equation tells us the value of C (along the hypothetical budget constraint).
The income effect is the difference between C** and C'.
This tells us that the income effect shows a quantity decrease. Because this stems from a loss of purchasing power, the income effect reveals that this is a normal good.
2. Suppose Louisville city and county governments are considering
two tax plans to finance the building of a professional basketball
arena. Those plans are:
Plan 1: a 20˘ tax on every gallon of gasoline sold within
Jefferson County
Plan 2: a $100 annual tax on every person living in Jefferson
County (regardless of age or income)
The government learns that both plans would raise the same amount of annual tax revenue. From the perspective of how these plans would each affect utility, discuss whether one plan is better than the other.
In the case of both tax plans, we can consider the indifference curve graph depicting how the typical consumer makes purchases of All Other Goods (AOG) and Gas. Plan 1 causes a change in the price of gasoline. In the graph on the left, we see that the tax causes the budget constraint to pivot down. As a result, this consumer moves from indifference curve IC1 to the lower indifference curve IC2. The government's tax revenue from Plan 1 is represented by the pinkish (dotted) vertical line between pt B and the upper budget constraint.
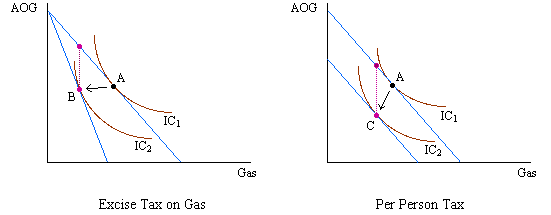
Plan 2 causes this consumer's income to decrease, leading to a parallel shift (decrease) in the budget constraint and movement from IC1 to IC2. Pt C represents the new consumption point. As above, the government's tax revenue is represented by the pinkish (dotted) vertical line between pt C and the upper budget constraint. Of course, if the revenue from these two plans is identical, then we can compare the utility reached from the plans by combining the two graphs.
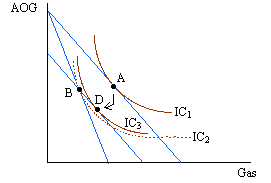
Note that having equal tax revenues implies that both (post-tax) budget constraints should go through pt B. When that happens, we can see that it is better for this consumer to go from pt A to pt D (a point on the budget constraint associated with Plan 2. Therefore, Plan 2 allows for greater utility, even though it raises the same tax revenue as Plan 1.
3. Briefly address each of the following.
a. Good A has a very large, and positive, cross-price elasticity with respect to several other goods. Suddenly, the price of one of these other goods decreases. Describe what will happen in the demand curve graph corresponding with this market and why.
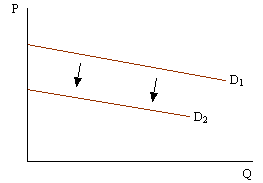
When the price of a close substitute decreases, the demand for this good will decrease. This is because consumers are moving toward purchases of the (now cheaper) substitute. The graph below shows this as a shift in the demand curve (from D1 to D2). Note also, that because this good has close substitutes, the slope of the demand curve is relatively flat.
b. What is the relationship between income elasticity and Engel's Law?
Engel's Law states that food purchases do not increase proportionately with increases in income. That is, even though my income doubles, my food consumption would less than double. Income elasticity is measured as the percentage change in the quantity demanded divided by the percentage change in one's income. Therefore, this Law implies an income elasticity that is inelastic (i.e. less than one). By definition then, food is a necessity.
c. You sell good X in one market and good Y in another market. You notice that when good X's price increases by 10%, the quantity demanded for good X decreases by 20%. If Y's price rises by 20%, then Y's quantity demanded also falls by 20%. Assuming that the demands for these two goods are linear, is it possible to increase your sales revenue by changing the price of either (or both) good?
When a demand curve is linear, sales revenue is always maximized where the quantity demanded corresponds with a price elasticity of demand that is equal to one. The price elasticity of demand is measured as the percentage change in the quantity demanded for a good divided by the percentage change in the price of that same good. Good X has an elastic demand, which means that this good has a price elasticity of demand equal to 2 in absolute value (20%/10%). Therefore, to maximize sales revenue, you should lower the price of good X until the price elasticity is one. Good Y has a price elasticity that is equal to 1 (20%/20%), so there is no need to change the price of this good.