One way in which the central authority may regulate an industry is by controlling the market price. For example, one type of price control is a price ceiling (where the government sets an upper bound on the market price). Price ceilings set below the equilibrium price cause shortages. With a shortage, it is necessary to determine how the product will be allocated. This handout illustrates that the size of deadweight loss can vary with the allocation rule.
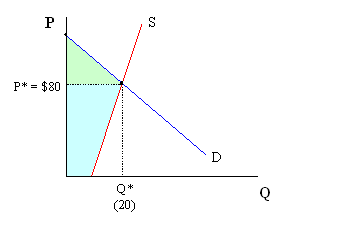
Assume a that there's a perfectly competitive market, where consumers buy (at most) one unit. The demand and supply curves are:
| Demand: | P = 100 – Qd |
| Supply: | P = - 40 + 4Qs |
Solving this model for the equilibrium price and quantity we get: P* = $80, Q* = 20.
On a graph, this appears as follows:
The greenish area above the price (P*) is the consumer surplus, whereas the turquoise area below the price is producer surplus.
Assume that a price ceiling (P.C.) is set at $40, which is below the equilibrium price of $80. The direct effect of the ceiling is a 50 unit shortage. We calculate the shortage by determining the difference between Qd and Qs at a price of $40.
When a shortage occurs, we have various means of allocating the good. Our question here is to ask about the welfare effects associated with using different allocation rules. That is, we ask whether different allocation rules have a different effect on total surplus. There are three rules we’ll consider below: (1) allocation according to willingness to pay, (2) allocation by lottery, and (3) allocation determined by demanders competing for the product.
Rule 1. Allocation by willingness to pay
Here, we allow consumers to purchase the good on the basis of how much they’re willing to pay for it. Note that if consumers buy only one unit each, the market demand curve represents each of the consumers who are interested in buying this good and orders them on the basis of their willingness to pay.
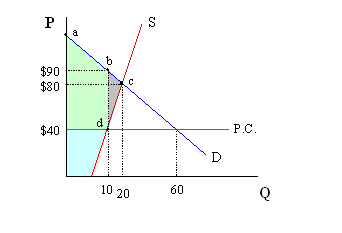
The consumers might be allowed to bid on the right to purchase this good. In this setting, only those with the greatest willingness to pay will make purchases. These consumers are located on the demand curve along the segment "ab". Those along line segment "bc" do not get to purchase the good because their willingness to pay is less. The imposition of the price ceiling lowers overall surplus (economic welfare). Consumer surplus is greater, but producer surplus is much less. Overall, total surplus decreases by the amount of the deadweight loss (grey-shaded area "bcd").
Rule 2. Allocation by lottery
In this setting, consumers may purchase the good if their name is selected as part of a lottery. Recall that, at P.C. = $40, 60 units are demanded and only 10 supplied. If everyone buys at most one unit, then that’s 60 consumers who will enter the lottery, but only 10 who will actually get to buy the good. That means that each consumer has a 1 out of 6 chance of being selected (i.e. 10/60, or probability of being selected = 1/6). Since only one-sixth of the consumers will purchase the good, our allocation rule implies that the resulting consumer surplus will is one-sixth of the area below the demand curve but above the price ceiling price of $40. On the graph below, the line segment "ad" allows us to see how large this area will be. The new consumer surplus is the greenish area below the "ad" line segment.
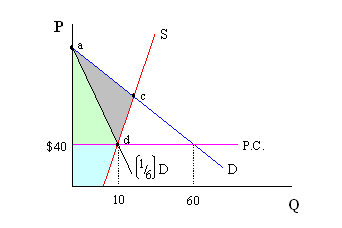
Whatever surplus is not recovered by demanders or suppliers here becomes deadweight loss, which is represented the grey-shaded area "acd". We can also compare the losses under these two allocation rules. Note that the greyish area associated with Rule 1 ("bcd") is smaller than the area associated with Rule 2 ("acd"). This difference implies that the first allocation rule is better than the second. When allocation is determined by lottery, a limited number of units are allocated to consumers who place a lower value on the good (i.e. those consumers associated with lower points on the demand curve). Those who want the good the most, in terms of how much they're willing to pay for the good, don't necessarily get the good.
Note that if a black market developed and consumers were allowed to resell the good, however, the deadweight loss from these two rules would converge. It’s in the best interest of the consumers with lower valuations to find the consumers with higher valuations. For example, suppose my name gets drawn in the lottery. I get to buy the good for $40, which is the most I’d be willing to pay anyway. However, if I can find someone out there who didn’t get their name drawn in the lottery but who’s willing to pay me $95 for my one unit, then I’ll gladly sell it and come out ahead. This will continue until only the individuals with the 10 highest willingness to pay valuations have the good.
Rule 3. Demanders compete for the product
If suppliers are allowed to allocate the good in any manner they choose, then consumers will undoubtedly compete against one another to acquire the product. This competition may occur in a variety of ways, but we expect a very similar result to that of Rule 1. We know that every consumer has a maximum price that they’re willing to pay, and that this consumer will pay up to the difference between that maximum price (i.e. reservation price) and the ceiling price. For example, using the graph below, we see that the person who would normally purchase the tenth unit (i.e. the person with the tenth highest reservation price) is willing to pay up to $90 for a good that will only cost them $40. Therefore, this consumer is willing to give up up to $50 worth of something to get this product.
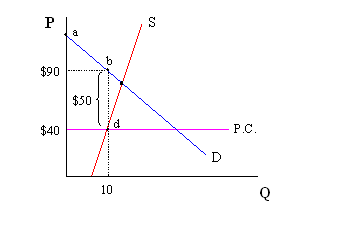
If allocation is determined by the supplier, then the supplier can dictate what that something will be. Suppose the supplier decides to make time be the resource given up by consumers. That is, suppose waiting in line is the determining factor. As discussed above, consumers will consider the opportunity cost of their time and decide upon how long to wait in line based on that. For example, if the consumer with the tenth highest reservation price (mentioned above) would lose wages of $10 per hour by waiting in line, then that consumer wouldn’t wait more than 5 hours in line to purchase the product. Since time is a real resource, giving up time to wait in line represents an additional welfare loss to society. The time spent waiting in line could have been spent providing labor in the production of additional goods and services.
It is also possible that this consumer might bribe the supplier, in order to acquire the product. Using the same logic, this consumer will not pay a bribe of more than $50. Because monetary bribes involve exchanging a pecuniary resource for this good, there is no additional welfare loss to society other than that associated with area "bcd" (see the Rule 1 graph). The reason why is because monetary bribes involve a financial transfer from consumer to supplier, rather than the transfer of a real resource.