Economists use a variety of models to study the inner-workings
of an economic system. One simple model that describes the production-side
of a given system is the production possibilities curve model
(PPC). Below, we discuss this model and use it to explain how
different events affect an economy.
Assumptions
The PPC model assumes that factors of production are used to transform
inputs into outputs. Let's assume that in Country A, there are
100 workers and 100 shovels available for use. Assume further
that Country A produces two goods, swimming pools and burial plots.
That is, workers can dig a big hole in the ground, fill the hole
with water, and call what they've done a swimming pool. Or, workers
can dig holes in the ground, throw a dead person in it, refill
the hole with dirt, and then call it a burial plot.
Production Possibilities
When all workers are employed, given a specific rate of productivity
and the level of technology they've chosen with which to dig these
holes, Country A has the following series of production possibilities
available (listed in columns below as options A - K).
| Swimming pools | |||||||||||
| Burial plots |
One option facing Country A is that all 100 workers and 100 shovels
could be used to produce only burial plots. In this case, they've
chosen option A. Similarly, Country A could direct workers and
shovels toward producing only swimming pools, and move to option
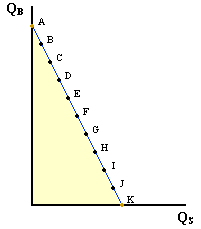
K. If we represent all of these production possibilities on a
graph, we have (QB = quantity of burial plots produced
in a specific period, QS = quantity of swimming pools
produced in a specific period):

Each of the options from the table are drawn as points on the
graph. Option A becomes point A, option B becomes point B, and
so forth. Unless there is a change in productivity, technology
or in the number of available factors, this economy will produce
at one of these points when all the available factors are employed.
Here, that means all 100 workers are employed and using all 100
shovels.
How much to produce?
It is important to understand that, at this point, we have only
described the production of these two goods. More specifically,
we only know how much production is possible. We don't know which
production option to select until we know something about demand.
Once the demand for each good is known, we can choose the production
option yielding the greatest profit.
What happens if demand is not high enough to sustain a production
point that corresponds with options A - K? In this situation,
it would be better to use fewer available workers and shovels.
These factors are still available and could be used, but by doing
so this economy would realize less profit. Therefore, some workers
and shovels might become unemployed (i.e. still available, but
not being utilized). This situation is illustrated below.

Suppose we're at a point like point F. One day, there is a decrease
in the demand for swimming pools, without any change in the demand
for burial plots. As a result, workers and shovels become unemployed.
The economy moves from point F to a point in the yellow area within
the PPC. Movement within this PPC continues until we arrive at
pt. W. At pt. W, this economy still has the same production possibilities
available to it, which are available when all workers are employed,
but chooses to produce less than what is potentially possible.
By definition, this is an inefficient use of factors and resources.