Marginal revenue (MR), in this case, would be MR = 100 - 3Q. The firm buys all of its books from a book publisher at $40 per book, making the bookstore’s average and marginal cost (AC and MC, respectively) always equal to $40. The bookstore’s AC and MC equations would be:
If the firm was to charge one price for book it sells, the demand, MR, MC and AC curves help us in determining that the bookstore will sell 20 books at a price of $70 per book. Economic profits would be $600 (you may want to verify this on your own).
Let’s assume that the bookstore owner hears about two-part tariffs
and would like to implement this pricing strategy. Students are
asked to pay a cover charge, just to enter the store, and may then
buy all the textbooks they want at some pre-determined price.
The lower the textbook price, the more consumers save. More specifically, the lower the price, the greater the consumer surplus. The bookstore knows that the two-part tariff pricing approach allows them to recover any lost profits (from lower prices) by raising the cover charge, so the firm will adjust the cover charge and textbook price to a point where profits are as high as possible.
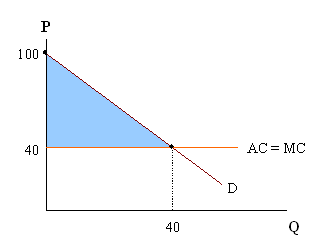
Given the demand for economics textbooks, the bookstore decides on a price of $40 per book. That is, the bookstore decides to sell the textbooks at cost. To determine how many books are sold at this price, we take the demand curve and plug the price of $40 in for P before solving for the quantity sold (Q).
In the absence of any cover charge, this would allow consumers to obtain (overall) consumer surplus of $1200. This is illustrated in the graph below, where the blue area represents consumer surplus.

Because consumer surplus is the area of the triangle bordered by the demand curve, price and vertical axis, we can calculate the area of this triangle as:
Because we don't have enough specific information about the various
consumers making up this market, including how many consumers there
will be, we can only make guesses at the cover charge.
For example, suppose there are 30 students who think they can save
money by paying the cover charge to enter the bookstore.
If the bookstore sets the cover charge at $25 per person and there
are 30 students willing to enter, then the firm can earn total profits
(i.e. profits from booksales + revenues from the cover charge) of $750.