Marginal revenue (MR), in this case, would be MR = 130 - 4Q. The firm’s average and marginal costs are constant, in that the AC and MC equations are both always equal to $40. These equations appear as follows:
If the firm was to charge one price for every ticket it sells, the demand, MR, MC and AC curves inform us that the firm will sell 30 tickets at a price of $70 per unit and make economics profits of $1800 (you may want to verify this on your own).
Let's assume that the firm has enough information on its market to
utilize a price discrimination pricing strategy. To be a price
discriminating monopolist, this firm must do two things:
- Separate consumers into different groups, based on differences
in their maximum willingness to pay for the firm’s product
- Prevent the resale of the firm’s product between these different groups
Let's further assume then, that the firm has determined that younger consumers (under 50) are willing to pay up to $80 per ticket for an upcoming heavy metal band concert and that older consumers (50 or older) are willing to pay up to $30 per ticket to rock on at this concert. If the firm uses price discrimination, based on age differences, how do we measure the effects of this pricing strategy on profits?
If the monopolist sets a price of $80, then we calculate the number sold by plugging P = 80 into the market demand equation and solving for Q.
If the firm sets a price of $30, then we can similarly calculate the number that would be sold at P = 30.
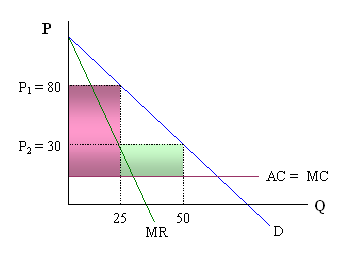
Of course, if there are two prices charged, we want to consider the additional sales that occur because of the lower price - which is the difference between the two quantities (25 and 50). Therefore, as the graph shows below, the $80 price will result in 25 tickets being sold to the younger group whereas charging the older consumers a price of $30 will cause the overall sales to increase to 50 tickets (i.e. an 25 additional tickets are sold).

Profits (p)
are measured as the net revenue generated from the sales of this
good at the two prices given above (where the "1"
subscript denotes the younger group, and the "2" subscript
corresponds with the older group). The pink area corresponds with the
profits derived from sales to group 1, and the green area corresponds
with the profits derived from sales to group 2.
The firm can obviously make more profits now than what would have
been attained in the pre-price discrimination system.
Note that we could have chosen a different pair of prices to
work with, and that our profits from price discrimination could
go up or down, depending on which prices we chose. For example,
prices of $90 and $10 would yield total profits of $1600; whereas
prices of $75 and $30 would yield total profits of $2287.50.
p
= (P1 – AC1)Q1 + (P2 –
AC2)(Q2 - Q1)