Barry Haworth
University of Louisville
Department of Economics
Economics 201
Shifts in Demand and Supply
When we work with the Demand and Supply model, there are two
things we’d like the model to tell us. The first involves determining
our starting point. For example, Demand and Supply tells us something
about the existing price and quantity exchanged within a particular market.
We can look at the current price and quantity then as our starting point.
Another way to characterize this is that we want to find the current equilibrium
point, because the equilibrium represents the existing price and quantity
in this model.
The second thing we want to know is how various outside events may affect
the model’s equilibrium. In other words, we want to ask whether the current
price and quantity will ever change. From closer inspection, we realize that
both the demand and supply curves will shift when certain events take place which
change the relationship making up each curve. This handout helps explain how
this occurs.
It is always possible that an event, or series of events, will occur which alters
the relationship making up either the demand curve or supply curve within a certain
market. To better understand this, we must differentiate between something that directly
affects a certain variable from something that indirectly affects that variable.
Demanders of a good make their purchasing decisions on the basis of how much
income they have available to spend, how a particular good’s price compares with the prices
of related goods they may buy either with or instead of that particular good, etc. These
are all events which directly affect the demand-related decision of a consumer. However,
events like production cost changes, productivity changes, etc., do not directly affect the
consumer’s demand-related decision. These events affect the supplier directly, who makes a
decision about the quantity to supply at each possible price, and only after that may, in
turn, affect demanders. That is, some events will affect the suppliers of a good directly.
The supplier reacts by increasing or decreasing supply, and then the demanders react to what
would be a change in price. Demanders are affected indirectly because the event affects
suppliers first.
Throughout our economic analysis then, when asking how an event affects the demand and
supply of a good, we will be focusing only on the direct effect. Therefore, let’s consider
the kind of things which affect Demand and (then) Supply directly.
Market Demand. Recall that we’ve defined a market demand curve as the quantity
demanded by all consumers in a given market at each possible price. Five variables
which can directly affect this relationship (i.e. increase or decrease the quantity
demanded at every possible price) include the following:
Income of demanders in this market
Price of Substitute Goods
Price of Complement Goods
Number of Demanders in this market
Tastes/preferences for good A
Suppose we assume that someone has surveyed the demanders of good A and asked how
many units of good A they would buy at each of the possible prices which might occur
in A’s market. After compiling those results, we get the following table.
|
Qd |
P |
|
10 |
$1 |
|
9 |
2 |
|
8 |
3 |
|
7 |
4 |
|
6 |
5 |
|
5 |
6 |
|
4 |
7 |
|
3 |
8 |
|
2 |
9 |
|
1 |
10 |
Let’s consider what happens if the number of demanders increases.
If there are more demanders in this market, then we should expect to find more
quantity being demanded at each possible price. For example, if demanders are
re-surveyed, then we might find that the table has changed to look like:
|
Old Qd |
New Qd |
P |
|
10 |
12 |
$1 |
|
9 |
11 |
2 |
|
8 |
10 |
3 |
|
7 |
9 |
4 |
|
6 |
8 |
5 |
|
5 |
7 |
6 |
|
4 |
6 |
7 |
|
3 |
5 |
8 |
|
2 |
4 |
9 |
|
1 |
3 |
10 |
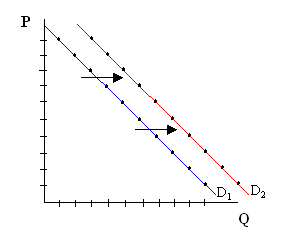
When graphing a demand curve for good A (see below), we plot the price and quantity
information on a graph with price on the vertical axis and quantity on the horizontal
axis. Showing the demand curve before and after the change reveals that the increase
in the number of demanders for good A has caused good A’s demand curve to shift to the
right (from D1 to D2). This is referred to as an increase in
demand, because the quantity demanded at each possible price has increased.
We could ask similar questions about the other events which would directly affect the
demand curve for good A, and get a similar answer. For example, suppose good B is
considered to be a substitute for good A. If there is an increase in the price of
good B, then the demand for good A will increase (shift right).
Market Supply. A market supply curve is defined as the quantity
supplied by all suppliers in a given market at each possible price. Some variables
which can directly affect this relationship (i.e. increase or decrease the quantity
supplied at each possible price) include the following:
Productivity (associated with producing good A)
Technology (associated with producing good A)
Cost of producing good A
Number of Suppliers in this market
As above, suppose that someone surveys the suppliers of good A and asks how
many units of good A they would supply at each of the possible price that could
occur in A’s market. After compiling those results, we get the following table.
|
Qs |
P |
|
1 |
$2 |
|
2 |
3 |
|
3 |
4 |
|
4 |
5 |
|
5 |
6 |
|
6 |
7 |
|
7 |
8 |
|
8 |
9 |
|
9 |
10 |
|
10 |
11 |
Let’s consider what happens if the number of suppliers increases. If there are
more suppliers in this market, then we should expect to find more quantity being
supplied at each possible price. Consequently, the table might change as follows:
|
Old Qs |
New Qs |
P |
|
0 |
2 |
$1 |
|
1 |
3 |
2 |
|
2 |
4 |
3 |
|
3 |
5 |
4 |
|
4 |
6 |
5 |
|
5 |
7 |
6 |
|
6 |
8 |
7 |
|
7 |
9 |
8 |
|
8 |
10 |
9 |
|
9 |
11 |
10 |
After plotting this information on a graph (below) with price and quantity on their respective axis, we see that the increase in the number of suppliers for good A has caused good A’s supply curve to shift to the right (from S1 to S2).
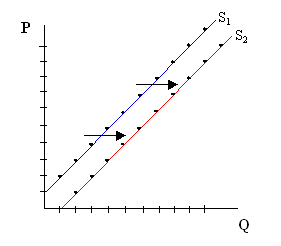 Note again, that we could answer similar questions about the
other events directly affecting the supply curve for good A.
For example, if there is an increase in the productivity associated
with producing good A, then the supply for good A will increase
(shift right). Note further that we describe increases as shifts
to the right in a particular curve and decreases as shifts to the
left, rather than as shifts up or down.
Note again, that we could answer similar questions about the
other events directly affecting the supply curve for good A.
For example, if there is an increase in the productivity associated
with producing good A, then the supply for good A will increase
(shift right). Note further that we describe increases as shifts
to the right in a particular curve and decreases as shifts to the
left, rather than as shifts up or down.